


Jacobs Futures | 1D, 2D, 3D, Go!
The Challenge | 1D, 2D, 3D, Go!
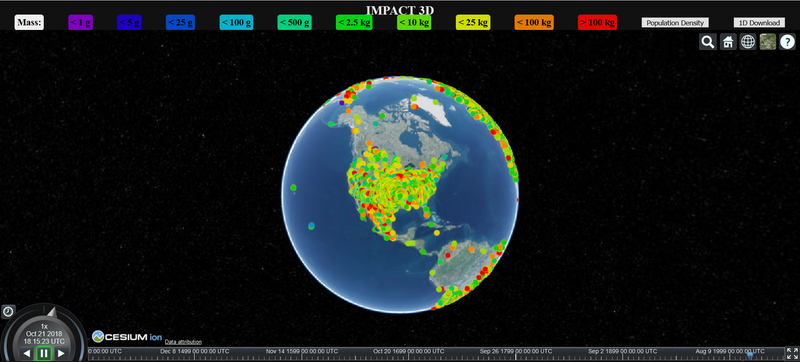
IMPACT3D
1D, 2D, and 3D Visualization Tool for Meteorite Impact Data and Population Density.
IMPACT3D is live.
Find us on GitHub.
Introducing IMPACT (Identify Meteorite’s Position, Analysis, and Categorization Tool) 3D. Utilizing CesiumJS, this tool optimizes the use of global data in 1D, 2D, and 3D visualization methods. Making data more interactive, accessible, and traceable for education and scientific purposes is our purpose.
A user can click a data point to learn more about every recorded meteorite like name, date discovered, and class. If they want even more data, there arelinks that allow the user to automatically Google more information about themeteorite in just a few clicks and to pull up a chart showing the classification types of meteorites.
A user can even play a video via a timeline animation to chronologically and visually model meteorite discoveries. A working imagery layer imported via a NASA Open API maps population densities across the globe relative to meteorite discoveries on or after the year 2000. Why? Larger population densities appear to be directly related to meteorite location and detection.
Additionally, users can easily download the data for use intheir external programs via a csv download option.
This is just the beginning. Meteorite tracking with Cesium was our Minimum Viable Product, but with the method in place, additional features are being created. We are currently adding extreme weather events like tornadoes and possibly NEO (Near Earth Objects) datasets to predict future meteorite falls.
Stayed tuned for what’s next for this tool.
Timeline:
- Evaluated different 2D and 3D visualization tools.
- Evaluated NASA datasets suitable for import into Cesium via API.
- Incorporated NASA Meteorite Dataset.
- Added widgets and additional functionality.
- Incorporated additional imagery layer for population density.
- Created animated timeline to visualize meteorite discoveries.
- Spun up a web server and site for public use.
Resources Used:

SpaceApps is a NASA incubator innovation program.