


Deep Space Musical | On the Shoulders of Giants
Team Updates
| from statistics import median | |
| import numpy as np | |
| import cv2 | |
| import skimage.measure | |
| import matplotlib.pyplot as plt | |
| import winsound | |
| finalnotes = [] | |
| im = cv2.imread(r'C:\Users\vikas\OneDrive\Desktop\Back ground\pillars.jpg', 0) # Can be many different formats. | |
| x=cv2.resize(im, (1500, 1000)) | |
| x = skimage.measure.block_reduce(x, (3,3), np.max) | |
| x = skimage.measure.block_reduce(x, (4,4), np.mean) | |
| nim = skimage.measure.block_reduce(x, (4,4), np.mean) | |
| notes = np.ndarray.flatten(nim) | |
| notes=list(notes) | |
| for item in notes: | |
| if item < 30: | |
| finalnotes.append(item*10) | |
| elif item < 50: | |
| finalnotes.append(item*4) | |
| elif item < 150: | |
| finalnotes.append(item*5) | |
| elif item>150: | |
| finalnotes.append(item*15) | |
| plt.imshow(nim) | |
| for n in range(0,672): | |
| winsound.Beep(int(finalnotes[n]), 350) | |
| print(n) |
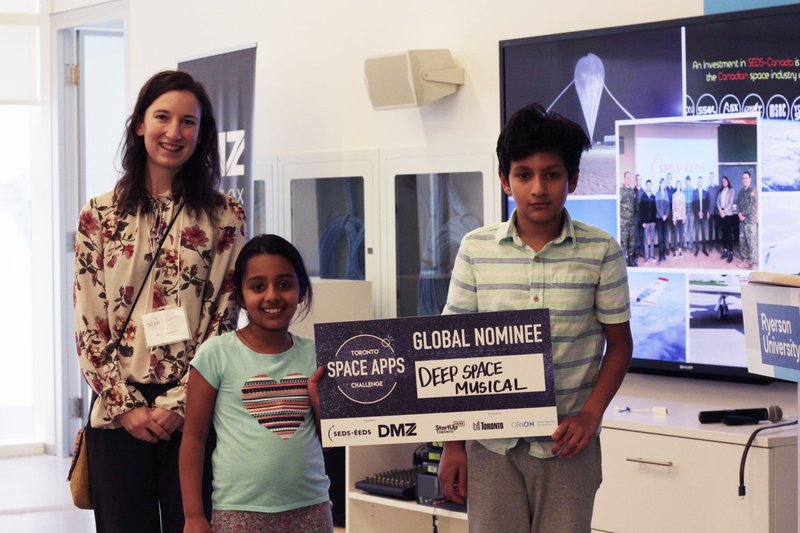
Winning the Global Nominee Award at the Space Apps Toronto Challenge
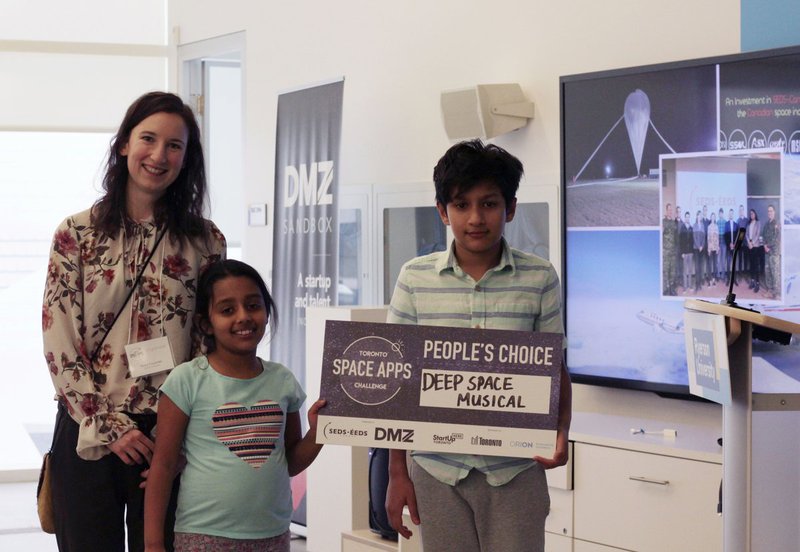
Winning the People's Choice Award at the NASA Space Apps Challenge
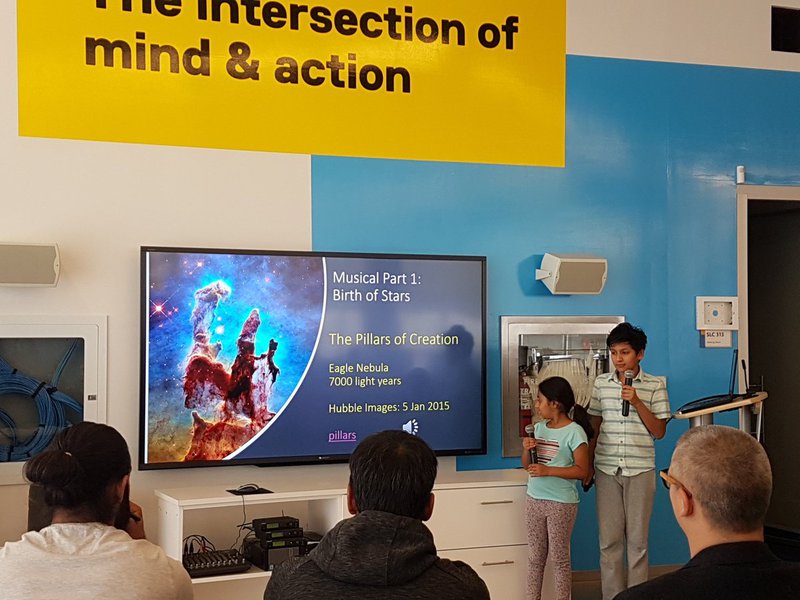
Presenting Deep Space Musical at the NASA Space Apps Toronto
We found out that Hubble Space Telescope took 1.3 million observations in last 28 years. We used some of them in our musical!
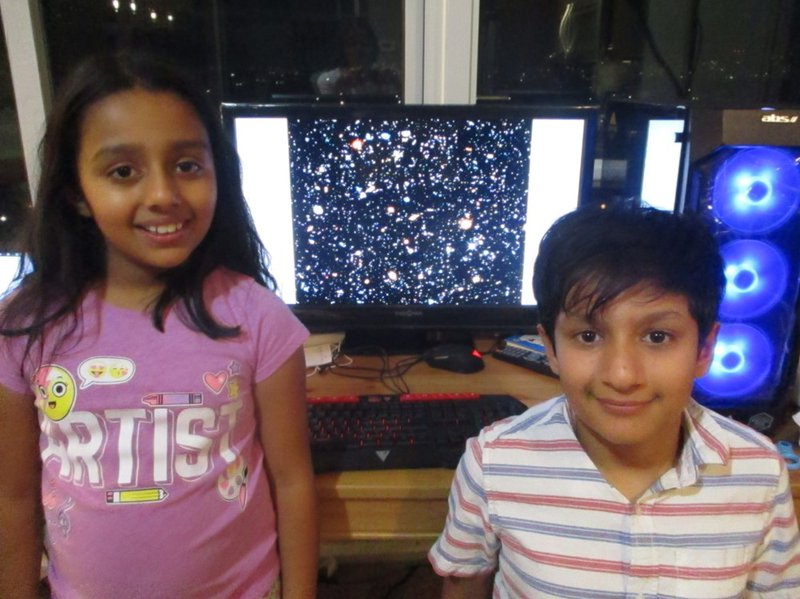
Team Picture

SpaceApps is a NASA incubator innovation program.