Health Factors | Health Makes Wealth
Team Updates


Look at our Git:
There you can find everything – from lines of script to pretty figures based on bootstrap calculations. You have no need to compile and install anything; just open our project notebook, and our work is exposed for your public viewing.The first calculation results were a bit discouraging. The people suffer from different environmental factors, and the temperature influence may be shadowed by other impacts. Now we’ll try to exclude space weather. Proper indices should be used. And – Eureka! – NOAA can provide such data about solar flares: https://www.ngdc.noaa.gov/stp/solar/solarflares.html
The main idea was to reveal some correlation between weather and health in USA. The time was limited, so we had to use air temperature only. Multiple Cause of Death Data was chosen as a health indicator. And the problem arose as temperature data were provided on a daily basis while mortality had monthly values. We solved this but now all the data are on a monthly basis. We have got 13 years of observations – from 1999 till 2011 years. It is not our choice, the data time range is limited by NASA.


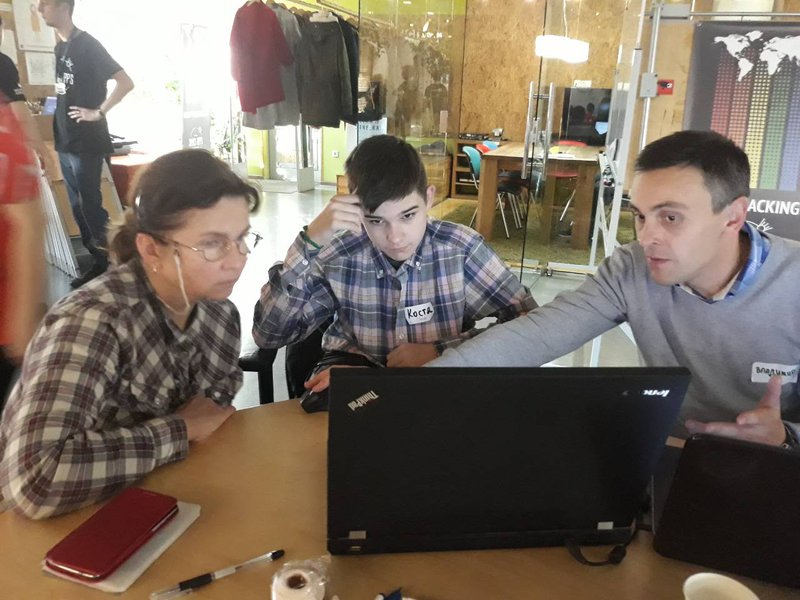
Our team had formed during Space Apps Challenge Bootcamp. The task was really a big challenge. Our youngest members had to begin their mathematical research work from the very low start. So they had to install Anaconda first.
SpaceApps is a NASA incubator innovation program.