


TeamGrit | 1D, 2D, 3D, Go!
Awards & Nominations
TeamGrit has received the following awards and nominations. Way to go!
The Challenge | 1D, 2D, 3D, Go!
Changing Climate?
If you talk to an old farmer or hiker you will discover they will tell you things have changed. We want to help you understand those changes as well. We are building a simplification of Earth Map data to see the effect on where you live.
Problem Statement
In our lifetime the planet has changed. Speaking to older people they will describe sledding in places that no longer get snow. Where we live my kids and used to sled on a hill near our house. That has not been possible in the last few years. The question "Is it likely to occur ever again?" is what we intent to answer for every datapoint collected in NASA datasets. Seeing the trendline of snow-cover may be revealing.
Minimally Viable Product
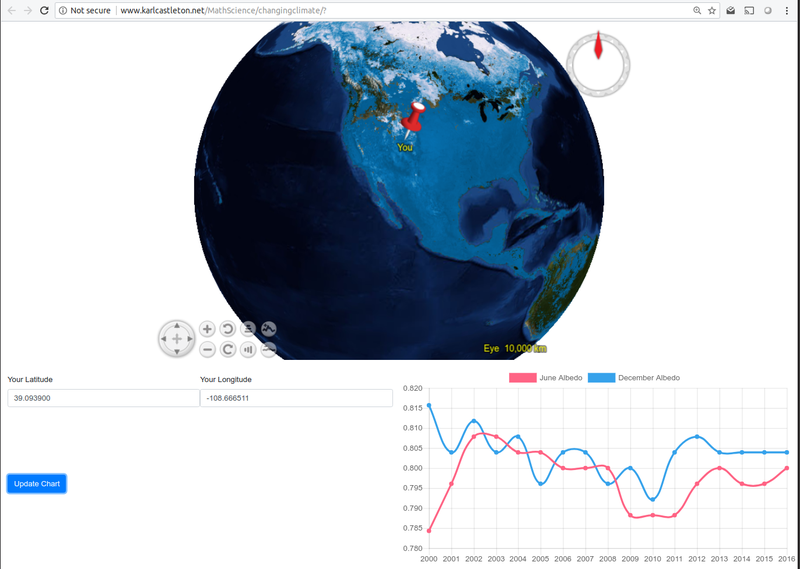
We were able to build a MVP that contains the albedo data for June and December for the years 2000-20016 for all Latitudes and Longitudes with .1 degree. The application is available here. It is completely implemented in client side Javascript so most code is contained in the SpaceAppsClimate.js that can be viewed as part of the page source. Also a JSFiddle was made of the working code, but it did not seem to function through JSFiddle.
Data Sources
We built a web application that is mobile-first responsive design and uses:
- NASA WorldWind to render layers (worldwind.arc.nasa.gov) on top of Earth sphere so the user can select their location using that map. The also have the option of entering latitude and longitude directly.
- We chose a layer that seems easy to communicate something related to snow-cover (Albedo MCD43C3_E_BSA). An alternate demonstration could have used the temperature layer.
- We queried the metadata for the Albedo layer to discover what dates are available
- Retrieved each time layer for a given location provided by the user and generate a graph of how snow-cover (Albedo) has changed at that location from the year 2000 to the year 2016
- Rendering the images to get albedo from 2000 to 2016 was slow. We changed so the files are captured once from the NASA the server at http://neo.sci.gsfc.nasa.gov/servlet/RenderData
Many other layers at NASA Earth Observations could be used, land temperature over time would be interesting as well, in the same tool. We chose Albedo because it is something people see and being different when the snow line does not come down as far as it used to on average.
We felt that discussing average sea temperature, while it is likely the most accurate average measure of climate change that showing people how things have changed where they live and in ways they care about.
Future Work
There were some items we came across that we would like to address in the future:
- Find/make a "True" HDF data server. We looked through many API's and data sources we could not find a way to query just the albedo from the hdf files directly for a given latitude or longitude (or nearest value). The only option we seemed to be downloading multiple thousand of files each being 200MB+ to our own server, then use available hdf tools to query just the data needed.
- The image ids for the NEO site render seemed to be unrelated to the underlying data files that are in the hdf format, which had strict year, month, and day as part of the filenames. It was necessary to create our own map to then names for June and December names by hand. Therefore we could not take the MVP as far as we wanted because of the time it was taking to find the ids for each year and month for albedo.
The presentation is available here

SpaceApps is a NASA incubator innovation program.