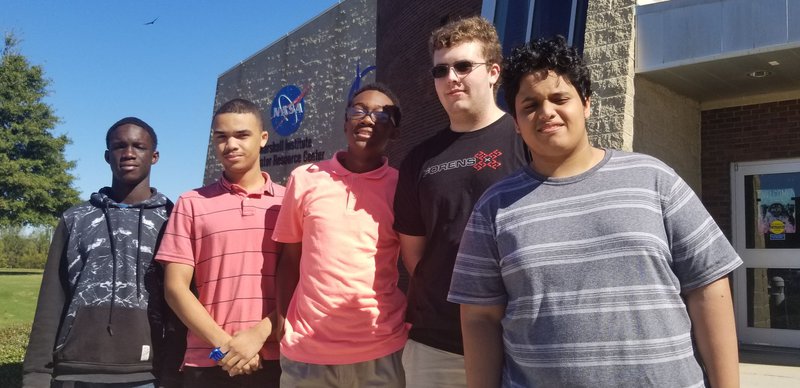
JCIB ForensX | Make Sense Out of Mars
The Challenge | Make Sense Out of Mars
Detecting and Measuring Dust Storms
Our sensor is a cheap, efficient way to easily measure the levels of light on the surface of mars. This data is then sent to a server that can display the data on graphs. The light levels are a great indicator of varying degrees of dust storms.

github: https://github.com/metalmulisha205/SpaceApps2018Fo...
Current State
We have an arduino that collects data on light levels (using a photon resistor) once a second and sends them to the server on our pc. We then add the data to an SQL database. From there, our data is displayed live on our website, with only a small delay. To prove that this could easily be adapted to detect dust storms, we did our best to simulate the light levels of a normal day on mars using a flashlight and then light levels of a dust storm on mars. We then created a line plot of two different lines, one for normal conditions, and one for a dust storm. The plot clearly showed that light levels peaked at a much lower level on days that had dust storms than days that did not have dust storms.
Future Implementations
These sensors are very cheap to make and could therefore be deployed on mars in bulk. From there they could transmit data to satellites in space that could interpret that data and transmit it back to earth. The data could be used for a multitude of things such as creating a machine learning model for earlier detection of a dust storm and predicting the path of that dust storm.
Why It Matters
Sand storms are very common on mars and are responsible for disabling solar powered rovers for extended periods of time. During the storm, sand sticks to the solar panels
on the rover and is very hard to get off, effectively disabling the rover. With a network of cheap sensors on the surface of mars, early detection and warning of sand storms would be possible and the rovers would have enough time to position themselves to receive minimal damage during the storm. We would also be able to gather a vast amount of data on the light levels on Mars that could lead to many other important discoveries.
Resources
We used an arduino and a photon resistor to collect data on the light intensity every second. We then used sqlite3 to put the data into an sql server so that our web server could render it. Pandas was used to load the sql server into a database so we could use plotly and dash to create our real time graphs. Jupyter Notebook was used to analyze our data and create prototypes of static visualizations.
Challenges
We were a bit ambitious on this project and sought to achieve much more than we did in reality. We built a website with working links and a navbar only to run out of time to add our dash website to it. We also derived a system to determine speed and direction of a storm but did not have the time to implement it with our project. However, we are still proud of our achievements and the challenges we did overcome. Another big challenge for us was getting the arduino to work properly. We were relying on its internal clock to collect data consistently every second, however we noticed this was not the case. We soon discovered that transmitting the data to our server was creating a power difference large enough to throw off our internal clock by just enough to mess our calculations up. To compensate for this, we began taking measurements in 3 different intervals, averaging them, and then transmitting to our server.
SpaceApps is a NASA incubator innovation program.