


Sunstorm | Health Makes Wealth
Awards & Nominations
Sunstorm has received the following awards and nominations. Way to go!
The Challenge | Health Makes Wealth
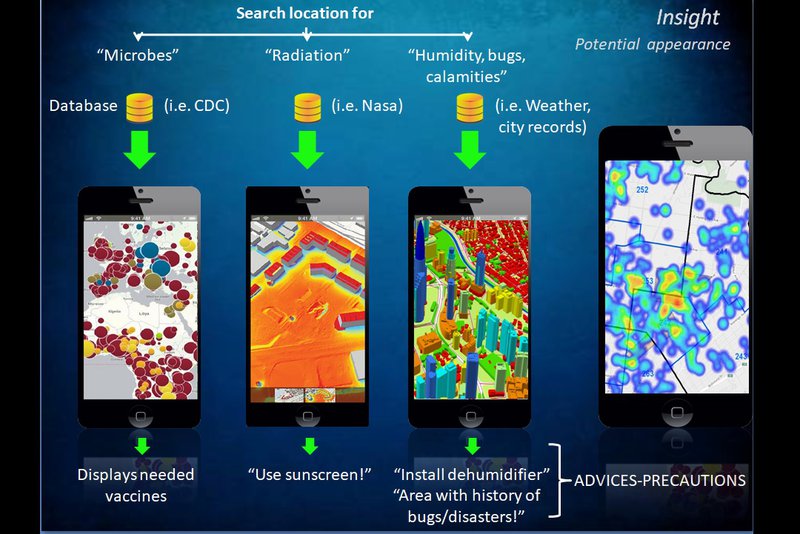
Insight: An enriched map
Insight is a satellite based app. It offers meaningful map visuals of microbe, allergens, pollution, radiation real-time and gives relevant advice. It unifies route planning and practical precautions, from hazardous areas and sunscreen to vaccines.
INSIGHT
CONTENTS
- Inspiration
- What is happening
- How it works
- What databases?
- Tell me what to do
- Summary
- How we see the future
INSPIRATION
-When I was living in North Portugal, places I couldn't see in my room caught mold. When Humidity levels are high, Insight sends a notification to "be careful" or "install a dehumidifier".
-In my trip to Canary Islands we were advised by our guide to put on sunscreen at all times because of the strong sunlight is harmful. If we were regular tourists we wouldn't have known. Insight makes the access to such information easy.
-My friend Theodora got suggestions about poor water quality, extreme UV radiation and about necessary vaccines for her trip to Morocco. However, she didn't know which vaccines and the validity of those claims . So she spent a lot of time searching for this information. Insight solves this with a simple tap on the screen.
WHAT IS HAPPENING
A map answers the question "How to go there?".
Insight answers the question "What's going on there?"
We see countless databases, researches and statistics exist. We receive data from almost 1900 active satellites (ref.1) .At conferences we are shown new charts, new statistics but we can't use them.
While we can access many of them, they are either untouched or hard to understand by most of us. They are basically useful data thrown away.
By exploiting the databases that exist and inserting them to Google Maps or something equally useful and amazing, we could get a richer understanding of the world instead of a simple map.
*That* is what Insight is about! A colorful unification of data and map.
HOW IT WORKS
Best way to understand this, is with an example. Let's say I want to travel to Morocco. While Google Maps shows me how to get there and how it is structured, it *cannot* show me the conditions that exist there.
-Which microbes, insects or allergens usually pop up?
-What's the pollution of the air in the neighborhood I'm thinking to rent?
-What does the water contain in that river - is it safe?
and many other things like the above.
So Insight uses various trustworthy *databases*, analyzes them and convert them to eye-catching and meaningful visual representations on our map. Then, if we want, it provides practical *advices* about the desired place.
The depictions are either Real-Time
or as updated as possible.
WHAT DATABASES?
Universal data. National data. My city's data!
Any credible database, statistic, or research related to the 2 main targets of Insight: Health and Environment.
•From NASA APIs
•From CDC, WHO* and Hospitals : Visuals on microbes, allergens, diseases (i.e. mosquitoes occurrence), viruses, causes of the common local accidents (*Centers for Diseases Control and Prevention, World Health Organization)
• From the local WaterProcessing companies: Water quality visuals
•From Pollution related services: Air and soil related visuals
•About Radiation: UV and other harmful radiation visuals
So for example, if I want to see the conditions of Morocco, I open Insight, tap the Health tab and choose what I want to see on the map.
The results can vary from visuals displaying the areas with allergens on the map to the usual occurrence of disease-carrying insects such as mosquitoes. When statistics are available, they can be displayed as *3D colored columns* on the different areas of the city or global map. Giving you a quick and easy view of the phenomenon chosen.
Next, the app offers related advices and precautions.
TELL ME WHAT TO DO
3 examples of the practical advices aspect of the app:
- Based on the microbes that live in a place, the app can tell the user what vaccines he should do before going there. Or it will display the route with the minimum exposure to certain allergens.
- If Radiation (UV rays etc) levels are displayed alarming in the interested area, the user taps on the Advices tab and reads the list of precautions. A notification can be displayed that tells the user to have sunscreen with him. If he is at the beach and UV levels increase a notification is sent to "use sunscreen", "Wear clothes that cover your skin", "Find shade" and so on.
- If the flat I want to rent is in an area with high humidity, or has high volume of bugs like cockroaches or a history on disasters such as floods, it will be displayed through an advice like "A dehumidifier will be useful to avoid mold in the house", "Be careful of bugs" etc. Either way the decision to rent there will be much more conscious, with no such surprises.
Simplified and beautiful visual representations of data on the map,
leading to better and quicker decisions. That's Insight!
SUMMARY
Insight is an evolution of the basic map, therefore it is easier to build than a fully new concept and therefore cheaper but meanwhile more practical to our daily lives.
The quality of the environment in our hands.
The depictions are based on either Real-Time data or as updated as possible.
Simplified and beautiful visual representations leading to better and quicker decisions
A business or product from quality environments will have more credibility and sell more than a business in a polluted environment.
Medical suggestions: a person living in a place lacking sun, can be suggested to "Prolonged lack of sun. Check Vitamin D levels".
A self-policing system will eventually occur leading to more useful data sharing, where an unregistered business will be less credible and popular to the user, similar to an unregistered business in Google Maps.
3D colorful depiction of statistics for better understanding.
HOW WE SEE THE FUTURE
We dream of a richer Insight, presenting more data such as from Telecommunication Companies (signal coverage and radiation visuals), cosmic radiation etc.
An interactive map: By *touching a building* you will be provided with not only information but also options such as Product List, Prices and Services they offer. i.e.
- You can order a product by tapping on a business on the map and choosing from its Product list.
- Tapping on a hospital will display the exams it offers and the needed documents.
- Searching for a bureaucratic document will display the building to get it from!
A simplified software can be built to offer *automated sorting and sharing* of the relevant data, narrowing the gap between the databases and their impactful use.
Insight: The quality of the environment in our hands
Thank you for your time.
RESOURCES
NUMBER OF SATELLITES IN 2018: https://www.pixalytics.com/sats-orbiting-the-earth...

SpaceApps is a NASA incubator innovation program.