


Unicode Unicorns | Polar Opposites
The Challenge | Polar Opposites
Design a data analysis and/or visualization tool to show the spatial and temporal changes in Arctic and Antarctic ice to a general audience.
Unicode Unicorns
Analyzing changes in the Arctic ice sheet mass and volume while also looking at weather metrics and ocean temperatures.
Project presentation: https://docs.google.com/presentation/d/1ZMykk9xPOC...
Project Repo: https://github.com/spaceappsnyc/UnicodeUnicorns
Our Twitter: https://twitter.com/UnicodeUnicorns
NSIDC Data Set: https://nsidc.org/data/RDEFT4/versions/1
This dataset is great, and I have to talk about why!
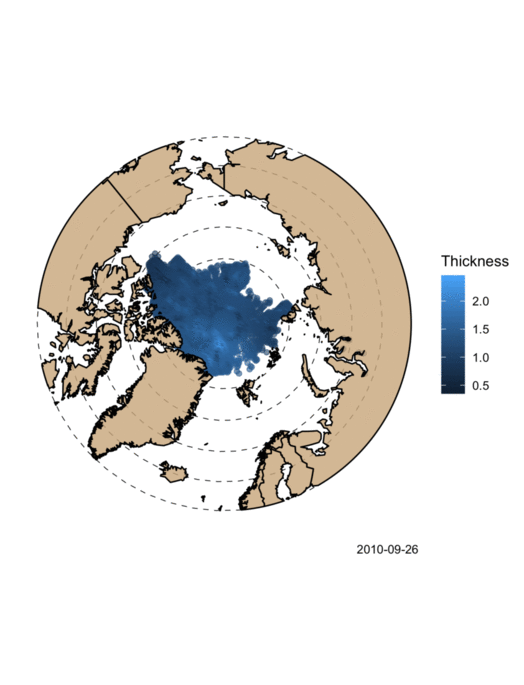
- The Latitude and Longitude values we pull act as central coordinates for a 25 km x 25 km square grid, the other columns being Thickness of the Ice Sheet for this square (in m) and the Day of this observation
- We removed all observations where Thickness was not greater 0, thus the surface area of the ice is linearly related to the length of the date subset, and the volume (or mass) is linearly related to the (mean Thickness of that day) * (length of the date subset)
- Thus:
- We've essentially made a discrete map of the ice, where the surface area is broken into equally sized squares and the volume is a grid of rectangular prisms with height = Thickness of ice. This data is already prepped and ready for parameterization.
- These metrics (surface area and volume), represented relatively, require no additional transformation to be intuitively understood.
Next Steps:
- Add additional mapped data or global averages to analyze how metrics change year by year based on yearly differences
- Query the World Weather Online API for things such as weather conditions, humidity, barometric pressure, and water temperature, all things that could change the projection of ice accumulation over time.
- Why does surface area plateau? The thickness keeps increasing, but the ice sheet can't spread any further apparently? Why?
- Time-series and interactive visualizations of the ice-sheet and other metrics,
- Use Shiny to build a web app showcasing these visualizations
Property of Kelby Stockstill and Katelyn Hertel 2018.

SpaceApps is a NASA incubator innovation program.