


MissionEarth | 1D, 2D, 3D, Go!
The Challenge | 1D, 2D, 3D, Go!
MissionEarth
MissionEarth is NASA data predictive analytics & visialiazation tool created for forecast of planet-scale human species emergency situations in atmosphere, biosphere and hydroshpere. Anyone will be able to see, when and what dangers might arise.
MissionEarth is predictive analytics, NASA data based application made for forecasting and visualization of environmental changes and crisises, which are critical for human species.
This is a solution for 1D, 2D, 3D, Go Challenge.
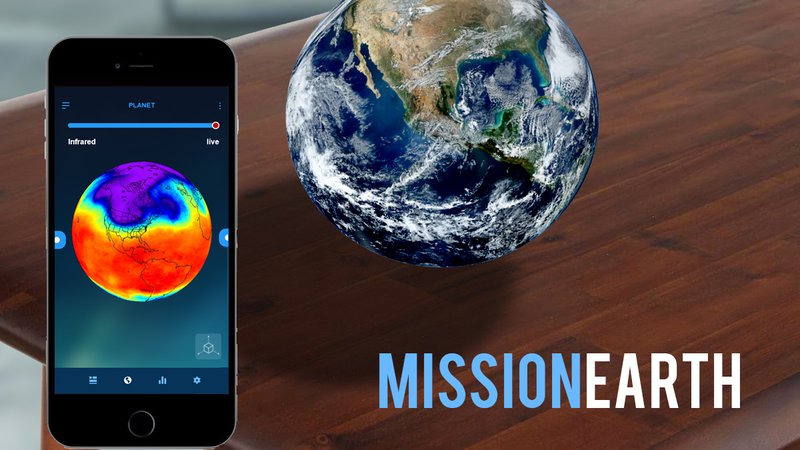
We solve problem of access to publicly & easlily available data and forecasts for such important dimensions as atmosphere, hydrosphere and biosphere. Using NASA data, we visualize Earth globe in infrared, daily world weather capture and track population. Anyone can pick a point of time when data is available and "play" with planet or even get AR version of it on one's table.
Second key feature gives forecasts of dangerous situations that might occur to human species in future and tough us with air, population and access to water problems. We build predictive models, using data and measure, when, how and why problems might happen and give knowledge base for being aware of such risks.
We aim to educate large audiences, starting from kids and students to sophisticated specialists, scientists and enthusiasts who care about environmental change problems.
Here's short overview of date we use:
1.Infrare layer:
https://oceancolor.gsfc.nasa.gov/data/viirs-snpp/
Data from The Visible and Infrared Imager/Radiometer Suite (VIIRS) device, installed on one of the Earth-orbiting satellites providing daily updates on infrared thermal imagery of earth surface.
2. World view:
https://worldview.earthdata.nasa.gov
This source provides daily updates on real-view satellite imagery of the Earth surface that can be used to illustrate various things, such as possible correlation of deforestation, desert expansion and lake drying-up with air pollution and thermal readings from VIIRS.
3. Air Pollution:
https://eosweb.larc.nasa.gov/tropospheric-composition
This dataset provides information on various other greenhouse gases concentration. Update time varies on the gas in question.
Carbon Dioxide
https://climate.nasa.gov/vital-signs/carbon-dioxide/
This Dataset illustrates monthly updates on Carbon dioxide (CO2) quantity (in parts per million) in Earth atmosphere since 1958. CO2 is an important heat-trapping (greenhouse) gas that is believed to be one of key factors of global warming.
We use key air polution metrics such as air quality index and high priority chemicals in air change to build forecasts.
5. Population:
https://earthdata.nasa.gov/about/daacs/daac-sedac
This dataset provides yearly updates on various socioeconomic data, such as urban population numbers.
Technology used:
Future releases are planned to be created using native iOS/Android SDK client and Python server software to process, analyze and distribute data to client software.

SpaceApps is a NASA incubator innovation program.