


xtenuate | Spot That Fire!
Awards & Nominations
xtenuate has received the following awards and nominations. Way to go!
The Challenge | Spot That Fire!
xTenuate
Fight fire with data.
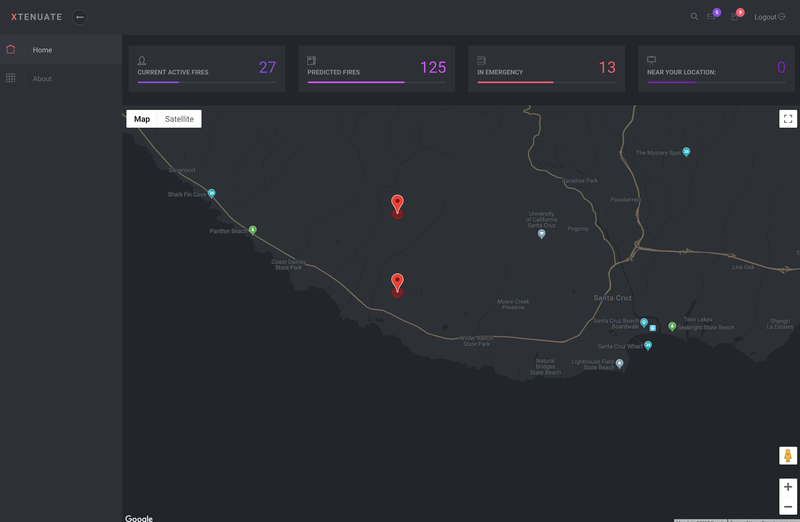
Why xTenuate?
According to the National Centers for Environmental Information, there have been 45,579 fires on the United States, in the months of January through August of 2018 alone.
That means 6,939,283 acres of land burned.
Fires that destroyed parts of Northern California exceeded 2.5 billion dollars in damages in 2017 according to Fortune.
However, the most heart-wrenching fact is the 91 lives that were tragically lost in the wildfires in Greece earlier this year.
xTenuate aims to predict, prevent, or at least help contain wildfires from causing further damage to our planet and all living beings within it.
What is xTenuate?
xTenuate is designed and implemented to help firefighters, police officers, and first responders manage or completely avoid a crisis situation. It serves as an action plan for governments and is meant to be handled by certified personnel who can correctly interpret the data and take appropriate actions.
xTenuate makes calculations based on past and current data in order to estimate the likelihood of a wildfire eruption. Giving all responding teams a heads-up, enabling them to be more vigilant, put containment plans in place before the situation escalates, and allow them to take precautions specific to the endangered areas. Furthermore, this platform will be able to give suggestions for fire-safe landscaping, such as the usage of: prescribed fires and fire-resistant plants. These suggestions will be constructed specifically for each region, taking into account its vegetation, landforms and weather conditions.
How does xTenuate work?
Methodology:
xTenuate - a cloud based platform, hosted in Google Cloud, uses Nasa's API to fetch useful information then process it using state-of-the-art algorithms.
Our solution uses two types of Supervised Learning Tasks, Classification and Regression.
On the Classification task, we use 'Random Forest Algorithm'[1] to tell us whether a particular place is prone to a potential fire in the near future.
A random forest is a meta-estimator that fits a number of decision tree classifiers on various sub-samples of the dataset and uses averaging to improve the predictive accuracy and control over-fitting. The sub-sample size is always the same as the original input sample size but the samples are drawn with replacement if bootstrap=True (default).

Generating a perfect model, is not always easy, in fact it is a quite difficult thing to do. That is why we built our model upon all the already proven techniques in the field.
For testing results, we built a predicting model using past historical data from years 2012-2017, focusing on the attribute “Confidence”. We did a case study for Canada, and we used attributes that NASA’s API gave us like: Latitude, Longitude, Brightness, Scan, Track, Acq_Date, Acq_Time, Satellite, Confidence, Bright_T31, FRP and Type. Basically we had to build our model using nominal, categorical, time series and numeric data.
Before we started training the algorithm, we had to check:
1. Whether we have missing values
2. Whether we have incorrect data
3. Whether we have outliers
It was only after checking these components that we could begin building our model.
We started by separating the dataset into three categories: training, testing and evaluation. For this task we used 70/20/10 approach where 70% of the data was used for training the Random Forest Algorithm, 20% for testing and the other 10% totally not exposed before to the model for evaluation.
For this particular case-study our model predicted 71.7% accuracy.
As for the Regression task, we have used ‘Multiple Linear Regression’[2] and fed the algorithm using the same approach of separating data into three partitions, for training, testing and evaluation.
Multiple linear regression attempts to model the relationship between two or more explanatory variables and a response variable by fitting a linear equation to observed data. Every value of the independent variable x is associated with a value of the dependent variable y.
Technologies used:
- Weka Tools
- MatplotLib
- Pandas
- Numpy
- IBM Cloud
- Google Cloud
What is the future of xTenuate?
xTenuate mobile application: plans to expand its services to ordinary audiences as well. Targeted users will be people who live in frequently affected areas. Our main goal will be to provide our users with some peace of mind.
Features we plan to incorporate into our mobile application include: live informative data about wildfires, the likelihood of them spreading dangerously close to the user’s location, safe evacuation routes, visualizations of data such as air pollution, wind direction, and speed.
Simultaneously, our users will be able to contribute to their own safety as well as the others’ by providing visual footage of fires, complete with precise location and weather conditions data, so that we can together improve xTenuate’s effectiveness and efficiency. This footage, accompanied by NASA’s satellite data of active fires will also let authorities know that the risk is imminent and that the call is not a practical joke and requires serious attention.
Some interesting findings:


Used API’s:
ftp://nrt3.modaps.eosdis.nasa.gov/FIRMS/
https://search.earthdata.nasa.gov/
Please check our prototype and experiment in Github: https://github.com/xtenuate

SpaceApps is a NASA incubator innovation program.